Realistic Cap Rates for Midway District San Diego Multifamily in 2026
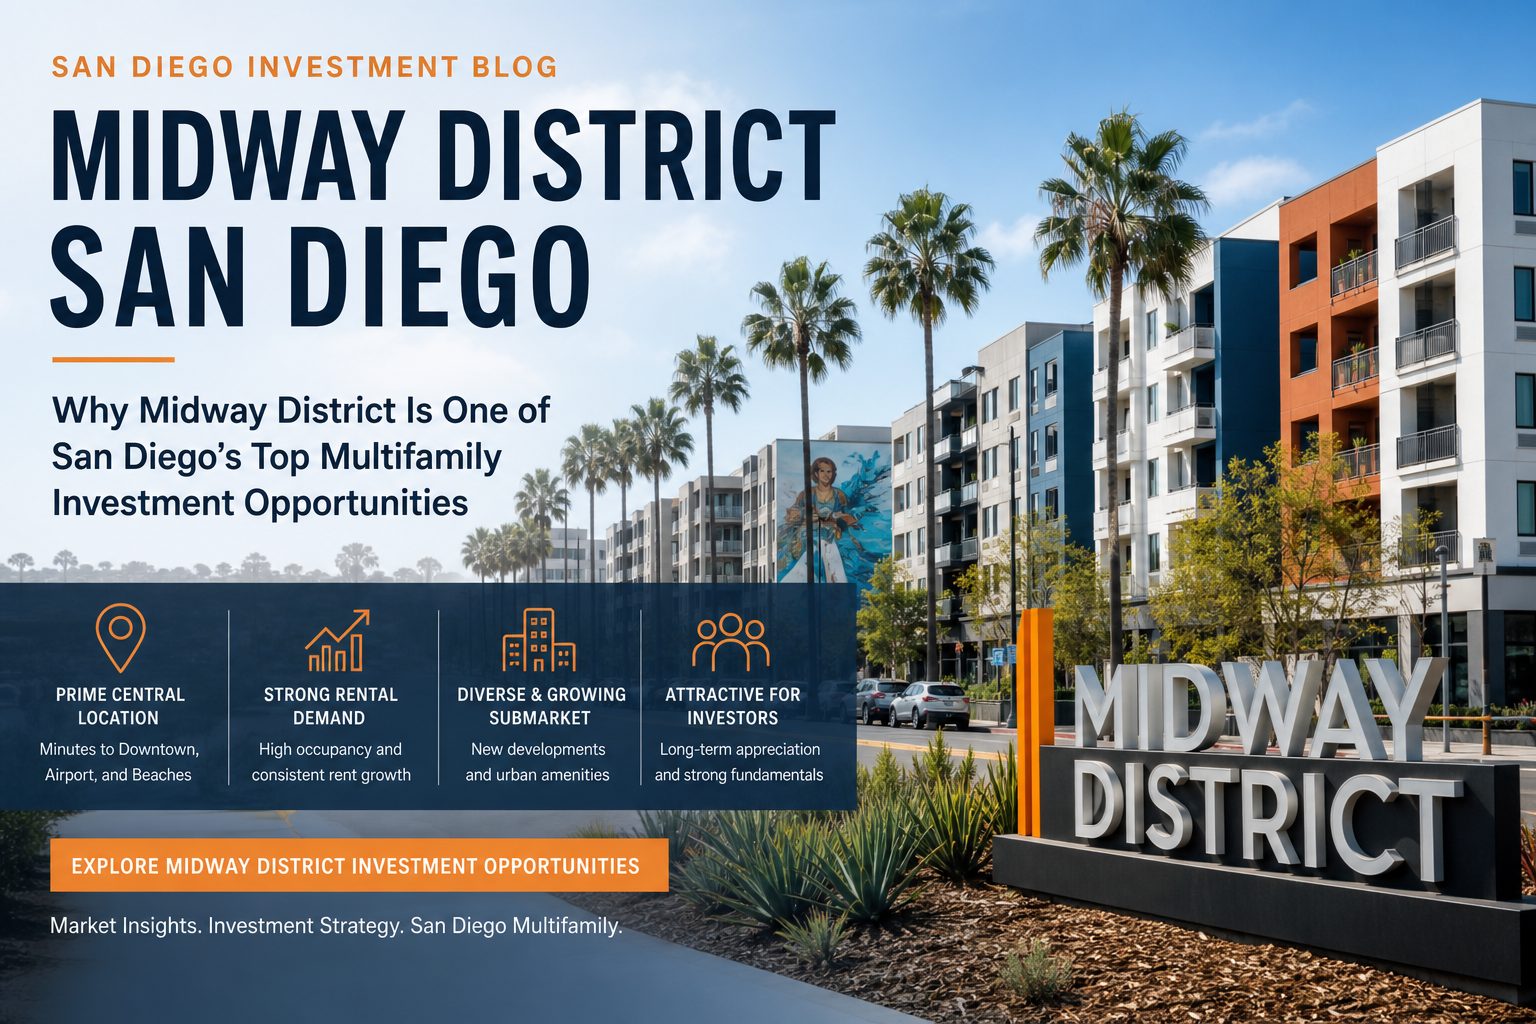
What are the realistic cap rates and cash-on-cash returns for buying a multifamily apartment building in Midway District San Diego in 2026 versus other asset classes like industrial or retail?
In the Midway District today, you can expect multifamily cap rates between 4.3% and 5.5% with cash-on-cash returns around 3.5% to 4.8%, while industrial assets offer 5.0% to 6.5% caps and multi-tenant retail ranges from 5.5% to 7.0%.
Why Midway District San Diego Demands Your Attention Right Now
If you have been watching the Midway District, you already know something big is happening. The $3.9 billion Midway Rising project is seeking to transform 49 acres of city-owned land into a walkable district with 4,254 new apartments, 14 acres of public space, and a new sports arena. Construction could start as early as late 2026, with phased buildout over 10 years.
That kind of transformation does not happen quietly. It reprices everything around it.
What does this mean for you as an investor? It means you are not just buying a cap rate today. You are buying into a submarket that is about to experience a generational shift in density, walkability, and tenant demand. But here is the thing: a cloudy mind can’t make decisions. So let me lay out the actual numbers across each asset class so you can see exactly where the math works and where it does not.
Multifamily Cap Rates and Returns in San Diego’s Midway District for 2026
Let me start with the asset class most investors ask about first.
The average multifamily cap rate in San Diego held steady at 4.7% in Q2 2026, unchanged year-over-year. That metro-wide number is your baseline. The median sold cap rate sits even lower at 4.3%, which is well below the 6.1% national multifamily average.
For Midway District specifically, you are looking at a profile similar to other urban-infill San Diego neighborhoods. Smaller properties like duplexes and triplexes in comparable areas trade at cap rates between 3.5% and 4.5%. Larger stabilized apartment buildings in the broader metro are trading in the 4.5% to 5.5% band.
What Cash-on-Cash Actually Looks Like
Here is where things get honest. Cash-on-cash returns for San Diego multifamily currently land around 4.8%, with IRR targets hovering at 7.70% according to recent lender data. Most active buyers are underwriting to a 5.5% to 6.0% yield requirement, and lenders are requiring higher debt-service coverage ratios.
One investor I worked with last year was evaluating an 8-unit building near the Sports Arena area. After running the numbers with a 25% down payment, the day-one cash-on-cash came in at roughly 3.2%. Not exciting on paper. But when we factored in the rent growth trajectory (Class B and C properties are seeing 1.7% to 3.4% increases annually) and the Midway Rising development timeline, the five-year outlook told a completely different story.
If you need strong cash-on-cash returns from day one, Midway District at today’s pricing may challenge your expectations. But this is a market where you are buying into appreciation and rent growth, not immediate yield.
Industrial Cap Rates in San Diego Compared to Midway District Multifamily
Industrial assets across San Diego County offer meaningfully higher cap rates, typically in the 5.0% to 6.5% range for stabilized properties. That premium over multifamily reflects a few key dynamics.
San Diego’s overall industrial vacancy rate declined 40 basis points year-over-year to 7.2% in Q2 2026. That sounds healthy until you dig deeper. Net absorption fell to negative 554,857 square feet in Q1 2026, a reversal of approximately 1.2 million square feet compared to the positive absorption recorded in Q1 2025.
The Trade-Off You Should Understand
So why do industrial assets still trade at higher caps despite San Diego’s constrained land supply? Because lease terms tend to be shorter, tenant improvement costs can be significant, and when a large industrial tenant vacates, your downtime is measured in months, not weeks.
Having closed over 275 transactions in the San Diego market and specializing in commercial properties, I have seen investors chase the higher cap rate on industrial without fully accounting for re-leasing risk. The math looks better on a spreadsheet until you are carrying a 15,000-square-foot vacancy for six months.
That said, if you find a well-located industrial property in a supply-constrained San Diego corridor with a creditworthy tenant on a long-term lease, the risk-adjusted return can genuinely outperform multifamily.
Retail Asset Returns in San Diego: How They Stack Up Against Midway District Apartments
Retail is the wild card, and it deserves more respect than most investors give it.
In San Diego, NNN single-tenant retail properties with strong credit tenants are trading at cap rates between 4.5% and 5.5%. Multi-tenant neighborhood and community centers offer cap rates from 5.5% to 7.0%, with estimated cash-on-cash returns in the 5.0% to 7.0% range.
Here is an important detail: despite high availability in some San Diego retail corridors, absorption turned positive in Q1 2026 for the first time in nearly three years. Asking rents increased while vacancy held steady. Consumer spending strength continues to support well-located retail.
A client I advised was torn between a 12-unit apartment building in the Midway area and a multi-tenant retail strip in a nearby San Diego neighborhood. The retail asset offered a 6.2% cap rate compared to the apartment building’s 4.6%. But when we stress-tested both scenarios for tenant turnover, the apartment building’s vacancy exposure was far more manageable, with San Diego’s multifamily vacancy sitting at just 5.5% overall, and Class B and C properties running at a remarkably tight 3.3%.
Comparing All Three San Diego Asset Classes Side by Side
Rather than giving you a generic recommendation, let me break down what the numbers actually tell you.
- Multifamily (Metro Average): Cap rates of 4.3% to 5.5%, cash-on-cash around 3.5% to 4.8%, vacancy at 5.5% in Q2 2026. Stable fundamentals with repricing driven by debt costs.
- Multifamily (Class B/C): Cap rates of 4.5% to 5.5%, cash-on-cash of 4.0% to 5.5%, vacancy at just 3.3% in Q1 2026. Strongest rent growth across all classes, with value-add properties seeing 5.38% rent increases.
- Industrial: Cap rates of 5.0% to 6.5%, estimated cash-on-cash of 4.5% to 6.0%, vacancy at 7.2% in Q2 2026. Negative absorption in Q1 suggests caution.
- Retail (NNN Single-Tenant): Cap rates of 4.5% to 5.5%, cash-on-cash of 4.0% to 5.0%. Stable with credit-dependent returns.
- Retail (Multi-Tenant): Cap rates of 5.5% to 7.0%, cash-on-cash of 5.0% to 7.0%. Positive absorption returning.
What jumps out? Multifamily offers the lowest cap rates but also the most predictable occupancy. Retail offers the highest cash-on-cash potential but carries tenant concentration risk. Industrial sits in the middle with yield premium but current absorption headwinds.
Why Midway District San Diego Multifamily May Win on Total Return
Here is what I tell my clients when they focus exclusively on cap rates: the cap rate is one metric, not the whole story.
With 16 years of experience in the San Diego market and a track record as a top 1% real estate agent in San Diego County, I have watched submarkets transform before. And the Midway District has catalysts that industrial parks and retail strips simply do not.
The Midway Rising project proposes 2,000 affordable apartment homes and thousands of market-rate units. That kind of density drives retail demand, transit improvements, and infrastructure investment. If you own existing multifamily in the path of that growth, your asset benefits from every phase of construction around it.
Average multifamily sales prices reached $398,509 per unit in Q2 2026. In the past 12 months, $1.8 billion worth of market-rate multifamily properties traded across San Diego, though transaction counts remain down over 40% compared to pre-pandemic levels. That lower transaction volume means less competition for well-positioned buyers right now.
San Diego’s fundamentals remain strong: over 115,000 active-duty military personnel provide a stable renter base, the biotech sector continues expanding, and coastal land constraints ensure that supply will never catch up to demand. Population data from San Diego County shows continued growth supporting long-term housing demand.
Frequently Asked Questions
What is the average multifamily cap rate in San Diego in 2026?
The average multifamily cap rate in San Diego held steady at 4.7% in Q2 2026. The median sold cap rate is even lower at 4.3%, which sits well below the 6.1% national multifamily average. Cap rates have largely settled in a band between 4.5% and 5.5% for stabilized properties across the metro.
What cash-on-cash return can you expect from a Midway District apartment building?
Realistic cash-on-cash returns for multifamily in the Midway District and comparable San Diego urban-infill areas currently range from 3.5% to 4.8%. Smaller properties like duplexes and triplexes may yield even less on day one, in the 2.0% to 3.5% range, making them primarily appreciation plays.
How do San Diego industrial cap rates compare to multifamily in 2026?
Industrial assets in San Diego typically trade at cap rates between 5.0% and 6.5%, offering a meaningful yield premium over multifamily. However, net absorption turned negative in Q1 2026 by over 554,000 square feet, signaling caution for investors entering this space.
What cap rates are San Diego retail properties trading at?
NNN single-tenant retail in San Diego trades at 4.5% to 5.5% cap rates, while multi-tenant centers range from 5.5% to 7.0%. Retail showed positive absorption in Q1 2026 for the first time in nearly three years, with asking rents increasing.
How does the Midway Rising project affect investment returns?
The $3.9 billion Midway Rising development plans to add 4,254 new apartments, parks, retail, and a new arena on 49 acres. Construction could begin in late 2026. Existing multifamily owners in the Midway District stand to benefit from increased density, improved infrastructure, and rising tenant demand.
What is the vacancy rate for San Diego multifamily in 2026?
San Diego’s multifamily vacancy reached 5.5% in Q2 2026, up 60 basis points from the prior year. Critically, Class B and C properties have just 3.3% vacancy, well below the 6.4% rate at Class A properties, making workforce housing the tightest segment.
Are Class B and C apartments a stronger investment than Class A in San Diego?
Right now, the data supports that thesis. Class B rents increased 1.7%, Class C saw 3.4% growth, and value-add properties experienced 5.38% rent increases, while Class A rents remained flat. Lower vacancy and stronger rent growth make B and C assets compelling.
What is the average rent for San Diego apartments in 2026?
The average asking rent for San Diego apartments reached $2,453 per unit per month in Q2 2026, reflecting a 0.82% increase year-over-year. Rents remain supported by tight supply and strong employment fundamentals.
Is now a good time to buy multifamily in Midway District San Diego?
Transaction counts are down over 40% compared to pre-pandemic levels, which means less competition. Mortgage rates are projected to fall to roughly 5.9% by the end of 2026. The combination of lower competition, stabilizing rates, and the Midway Rising catalyst creates a window worth evaluating seriously.
Should you choose multifamily over industrial or retail in San Diego?
It depends on your investment goals. If you want predictable occupancy and long-term appreciation in a transforming submarket, Midway District multifamily is compelling. If you need higher day-one cash flow, multi-tenant retail offers stronger yields but with more tenant risk. Industrial offers a middle ground but faces absorption headwinds.
The Bottom Line
You are making this decision during a repricing cycle, not a crisis. San Diego’s commercial real estate market is recalibrating, and the investors who deploy capital with discipline during this window tend to define the next cycle’s outperformance.
Midway District multifamily will not give you the highest cap rate among these three asset classes. But it offers the tightest vacancy, the most durable rent growth, and a once-in-a-generation redevelopment catalyst that industrial parks and retail strips simply cannot match.
With 180 five-star reviews from past clients and 16 years navigating San Diego’s commercial and residential landscape, I am here to help you run the numbers on specific Midway District properties and build a clear, data-informed acquisition plan. Reach out to me, Scott Cheng, at 858-405-0002 or visit my office at 16516 Bernardo Center Dr. Ste. 300. A calm plan beats a cloudy mind every time.
Have Questions About San Diego Real Estate?
Scott Cheng provides free, no-obligation consultations for buyers, sellers, and investors.
Schedule a Consultation