Vacancy Rate Trends and Rent Growth for Mission Valley San Diego Retail Strip Centers in 2026
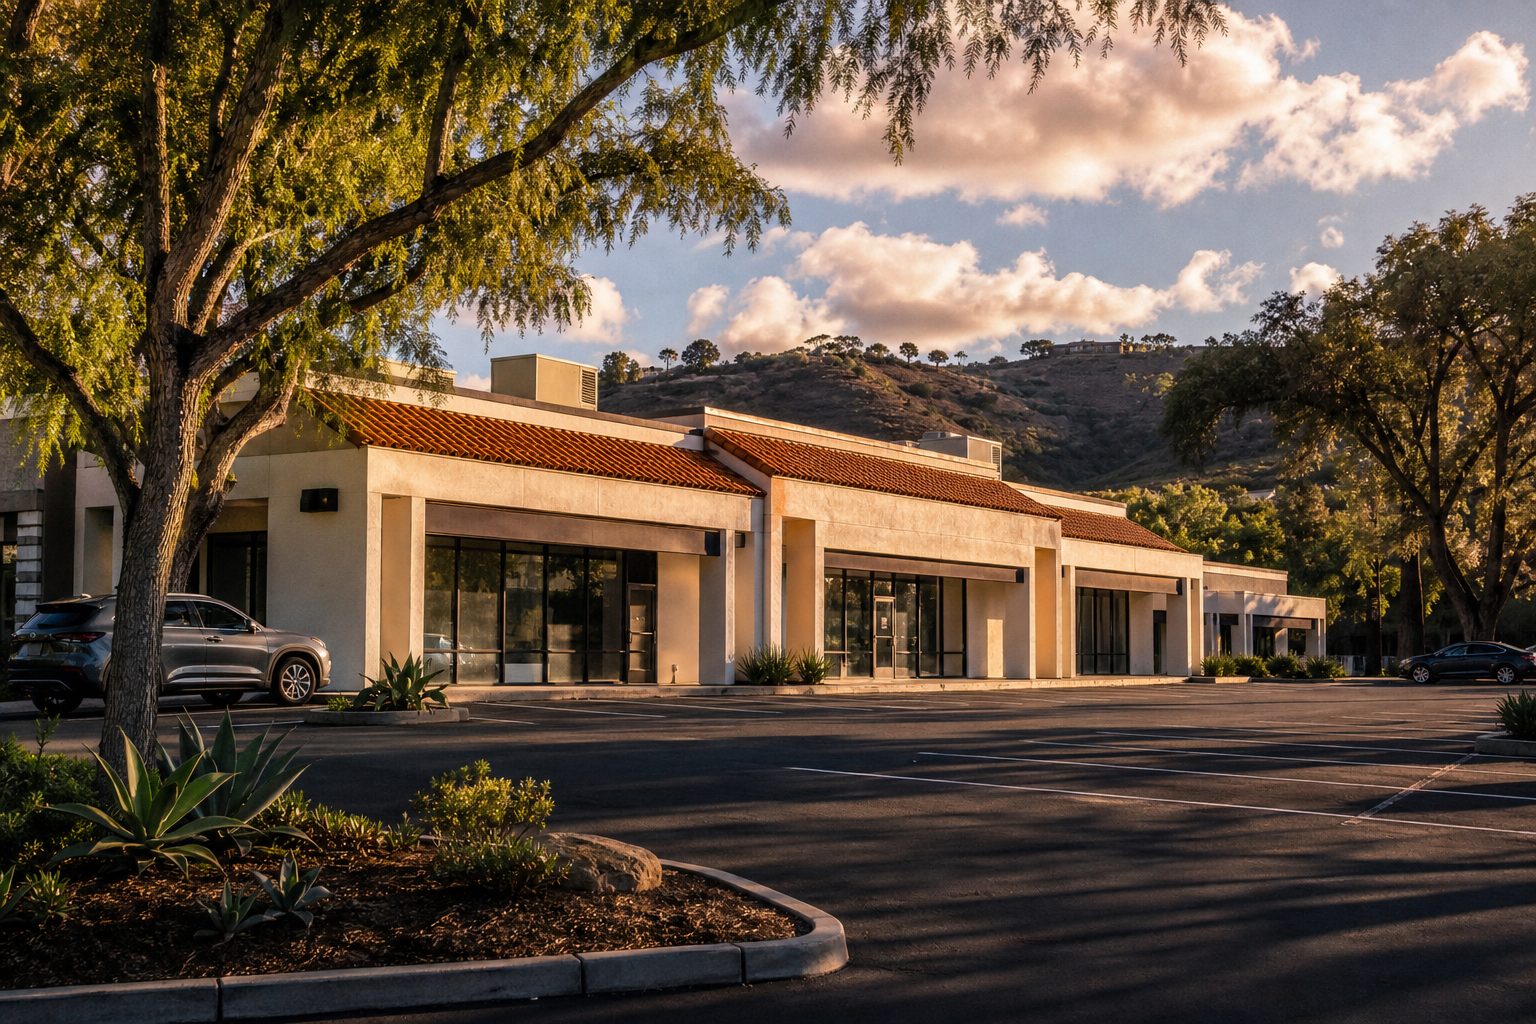
What are the real vacancy rate trends and rent growth projections you need to evaluate before buying a retail strip center in Mission Valley, San Diego in 2026?
San Diego County retail vacancy is hovering near 4.3% to 4.5% as of mid-2026, with rent growth decelerating to under 1% annually, and Mission Valley’s massive redevelopment pipeline adds both opportunity and complexity to your underwriting.
Why This Matters Right Now for Mission Valley Investors
If you’re looking at a retail strip center in Mission Valley right now, you’re walking into one of the most dynamic commercial corridors in San Diego. The numbers on the surface look healthy. Vacancy is low. Rents are holding. But beneath those headline figures, there are real shifts happening that could make or break your deal.
I spend a lot of time helping investors evaluate San Diego properties, and what I tell my clients is this: a cloudy mind can’t make decisions. So let me bring you the clean data, the context behind it, and a framework you can actually use. With 18 years of experience and over 275 transactions closed across San Diego, I’ve seen how market cycles play out on the ground, not just in the spreadsheets. Here’s what you actually need to know.
San Diego Retail Vacancy Rates: The Real Numbers Behind the Headlines
The countywide retail vacancy trajectory tells an important story if you read it carefully. Here’s how it has tracked over recent quarters, per Colliers, Kidder Mathews, and Pacific Coast Commercial research:
- Q4 2024: 3.77%
- Q2 2025: 4.4%
- Q3 2025: 4.5% to 4.8%
- Q4 2025: 4.22%
- Q1 2026: 4.24% to 4.65% (per Colliers and VOIT, respectively)
- Q2 2026: 4.5% (per Kidder Mathews)
- Q3 2026: 4.3% (per Pacific Coast Commercial)
What does this actually mean for you? The vacancy rate is drifting slowly upward but remains close to the long-term market average of 4.4%, according to Kidder Mathews. That’s historically healthy. San Diego retail is outperforming nearly every other commercial property type in the county right now, especially when you compare it to office vacancy sitting at 13.4% in Q2 2026, per Kidder Mathews.
But here’s the critical piece most investors miss: vacancy staying low doesn’t mean demand is strong.
The Negative Net Absorption Warning You Cannot Ignore in San Diego
This is where your strip center evaluation gets real. While vacancy rates look stable, net absorption tells a more honest story about tenant demand.
According to Kidder Mathews, year-to-date net absorption totaled negative 208,667 square feet through Q2 2026. That means more tenants vacated retail space than moved into it during the first half of the year. In Q1 2026 alone, net absorption was negative 162,959 square feet, per Colliers, nearly wiping out the positive 165,453 square feet recorded in Q4 2025.
So why isn’t vacancy spiking? The answer is constrained supply. San Diego had only 290,191 square feet of retail space under construction as of Q2 2026, per Kidder Mathews, a 16.24% decline from 346,465 square feet the year before. Since 2020, roughly 3 million square feet of retail has been demolished, and net supply is actually down by 1.3 million square feet, according to Matthews Real Estate research. Rents would need to rise by roughly 40% for many new retail projects to pencil out.
What this means for your strip center deal: you’re buying into a market where the low vacancy is being propped up by shrinking supply, not surging demand. That distinction matters enormously when you’re projecting future occupancy in your pro forma.
What to Scrutinize in Your Due Diligence
- Tenant credit quality and lease rollover schedules for every unit
- Weighted average lease term remaining across the rent roll
- Whether any tenants are in categories experiencing negative absorption (big-box, general merchandise)
- Percentage of tenants on month-to-month versus long-term leases
Rent Growth Projections: What Your Pro Forma Should Actually Assume in Mission Valley
Rent growth is the other half of your return equation, and the trajectory here has shifted meaningfully. Here are the recent data points from Colliers and Kidder Mathews:
- Q2 2025: $2.36/SF/month NNN, with 1.5% annual growth (per Kidder Mathews)
- Q4 2025: $2.39/SF/month NNN, with roughly 1.0% annual growth (per Colliers)
- Q1 2026: $2.42/SF/month NNN, with 5.6% year-over-year growth (per Colliers)
- Q2 2026: $2.38/SF/month NNN, with 0.96% year-over-year growth (per Kidder Mathews)
The Q1 2026 spike to 5.6% is an outlier worth investigating before you bake it into your model. The broader trend is clear: rent growth has moderated from roughly 5% at its 2023 peak to under 1% as of Q2 2026, per Kidder Mathews. Overall asking rents remain more than 33% higher than a decade ago, according to Matthews Real Estate, so landlords aren’t hurting. But the days of aggressive annual escalators are behind us for now.
What I recommend to my investor clients: underwrite 1% to 2% annual rent growth for a Mission Valley strip center. Using anything above 2% without a very specific lease-driven justification is optimistic relative to current market data.
Mission Valley’s Transformation: How 13,000 Planned Homes Reshape Your Retail Thesis
Here is where Mission Valley gets genuinely interesting for a retail strip center buyer, and where you need to think beyond the current quarter’s numbers.
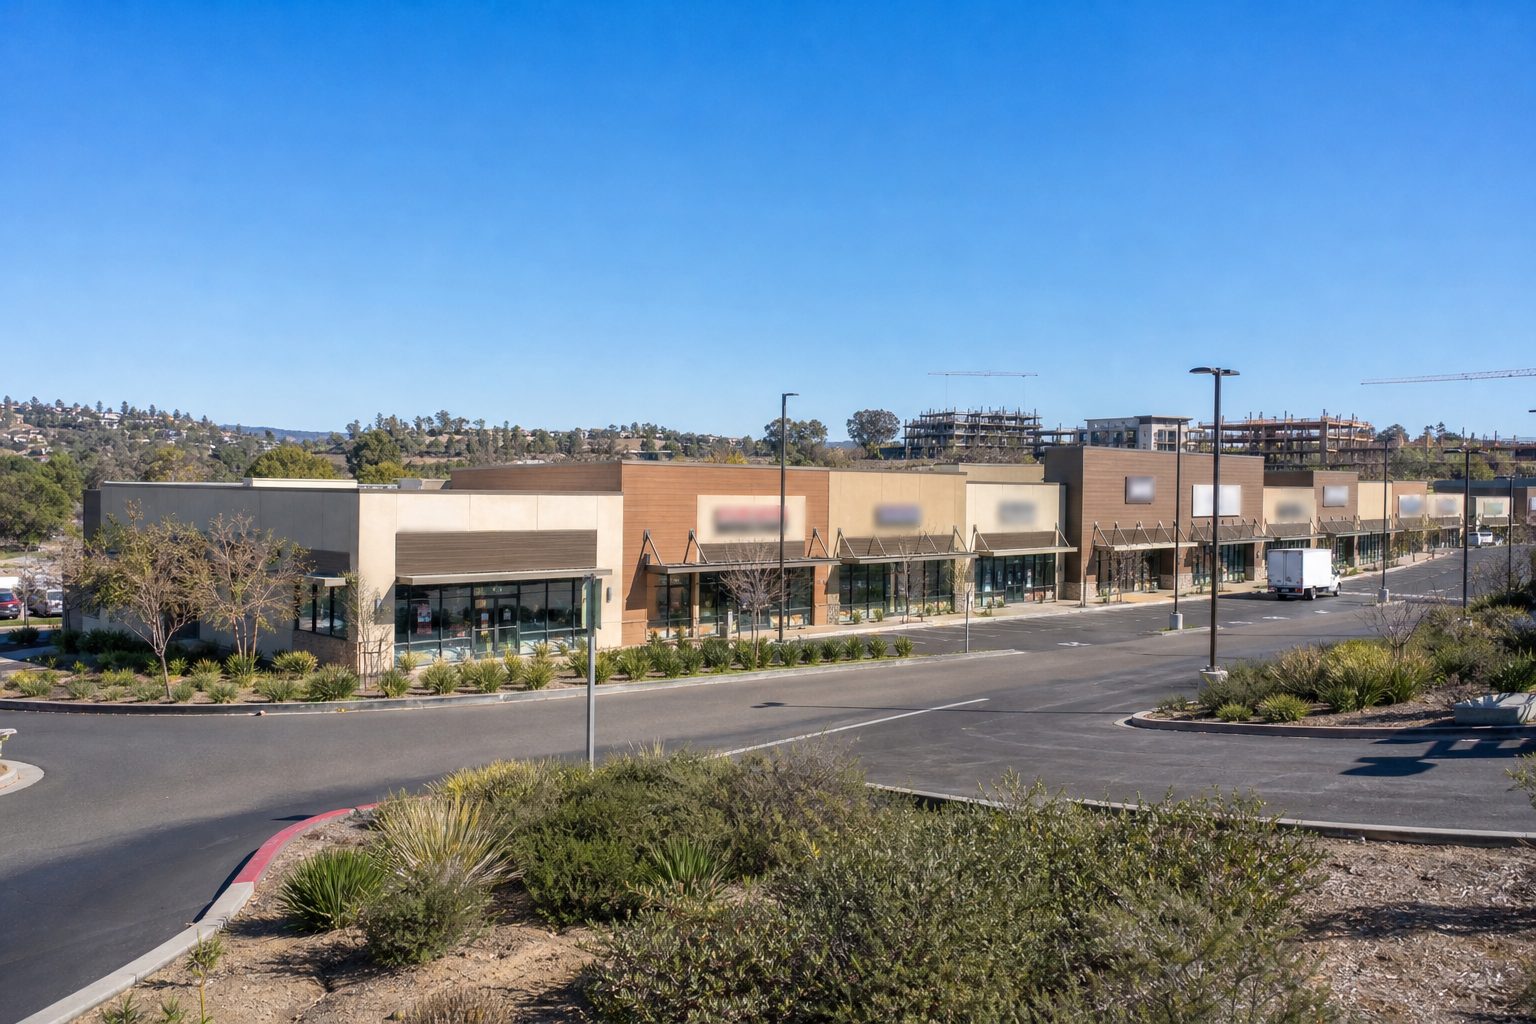
Mission Valley is experiencing one of the most significant urban transformations in San Diego history. The SDSU Mission Valley project includes Snapdragon Stadium, an Innovation District, housing (up to 4,600 units at full buildout), a hotel, retail space, and more than 80 acres of parks and open space, including a 34-acre River Park. The Riverwalk development by Hines covers roughly 200 acres with plans for 4,300 residential units, over 150,000 square feet of retail, about 1 million square feet of office space, and more than 100 acres of parks and trails. As of mid-2026, the market-rate apartment component of Riverwalk Phase One is nearly 30% complete, according to the San Diego Business Journal.
Together, these major projects account for roughly 13,000 planned homes, though their buildout stretches well past 2027. First occupancy for Riverwalk residential isn’t expected until spring 2028, and the overall project completion timeline extends into the 2030s.
What This Means for Your Strip Center Purchase
- Short-term (2026 to 2028): Construction disruption. Noise, traffic detours, and a submarket in transition. Your existing tenants may feel the friction.
- Medium-term (2028 to 2031): Thousands of new residents arriving within walking distance of existing retail. This is when demand-side fundamentals start to shift favorably for well-positioned strip centers.
- Long-term (2031 and beyond): Full buildout creates a dense, transit-oriented, mixed-use community. A strip center with strong visibility, access, and the right tenant mix could benefit enormously.
Additionally, 1895 Camino Del Rio South in Mission Valley represents a significant under-construction retail project at 106,688 square feet with a Q3 2026 delivery date, per Kidder Mathews. You’ll want to understand how that new supply will affect your competitive position.
Cap Rates, Sale Prices, and What San Diego Retail Is Actually Trading At
You need market comps to frame your acquisition price. Here’s where San Diego retail investment metrics stood as of Q2 2026, per Kidder Mathews:
- Average retail cap rate: 5.4%, up 70 basis points from 4.7% a year earlier, though down from 6.1% in the prior quarter
- Average retail sale price: $446 per square foot, up 12.81% year-over-year from $395 per square foot in Q2 2025
Notable Q2 2026 sale transactions for context include Poway Marketplace (79,853 SF at $26.5M, or $331.65/SF), Prism Places Equinox in Carlsbad (30,800 SF at $26.2M, or $852/SF), and Escondido Gateway (69,552 SF at $22.1M, or $317.19/SF).
Having closed over 275 transactions and holding 300-plus five-star reviews across platforms, I understand how San Diego commercial deals come together. Rated 5 out of 5 by past clients, I also provide a complimentary attorney contract review with every transaction, covered by me even if escrow cancels. That extra layer of contract protection matters when you’re negotiating a retail acquisition with complex lease assignments and seller representations.
Frequently Asked Questions
What is the current retail vacancy rate in San Diego County as of 2026?
San Diego County’s retail vacancy rate stood at 4.3% as of Q3 2026, per Pacific Coast Commercial, and 4.5% as of Q2 2026, per Kidder Mathews. These figures remain close to the long-term market average of 4.4%. This is historically healthy compared to other commercial property types in the county.
How much are retail rents in San Diego per square foot right now?
Average retail asking rents in San Diego reached $2.38 per square foot per month on a triple-net basis in Q2 2026, per Kidder Mathews. This was up 0.96% year-over-year from $2.36 in Q2 2025, though it dipped slightly from $2.42 in Q1 2026.
What annual rent growth should I model for a Mission Valley strip center?
Based on current trends showing rent growth has moderated from roughly 5% in 2023 to under 1% in Q2 2026, per Kidder Mathews, conservative underwriting suggests 1% to 2% annual rent escalation. Anything higher needs lease-specific justification.
Why is retail vacancy low if net absorption is negative in San Diego?
Supply is shrinking faster than demand is weakening. Roughly 3 million square feet of retail has been demolished since 2020, per Matthews Real Estate, and new construction pipelines are declining. This structural supply constraint keeps vacancy tight even with negative absorption.
What are typical retail cap rates in San Diego for 2026?
The average retail cap rate in San Diego was 5.4% in Q2 2026, per Kidder Mathews, up 70 basis points from 4.7% a year earlier. Cap rates had been as high as 6.1% the quarter prior, suggesting ongoing volatility in pricing expectations.
How will the SDSU Mission Valley development affect nearby retail?
SDSU Mission Valley plans up to 4,600 housing units at full buildout with first residential occupancy expected in 2028. This massive population influx should drive meaningful retail demand over time, but the construction period creates near-term disruption for existing retail tenants.
What is the Riverwalk project adding to Mission Valley retail supply?
Riverwalk plans over 150,000 square feet of retail space alongside 4,300 residential units and about 1 million square feet of office, per San Diego Business Journal reporting. Phase One construction is underway with first homes expected in spring 2028.
How much retail space is under construction in San Diego?
San Diego had 290,191 square feet of retail under construction as of Q2 2026, per Kidder Mathews, representing a 16.24% decline from 346,465 square feet the year before. The shrinking pipeline signals limited near-term competition from new development.
What is the average sale price per square foot for San Diego retail?
The average retail sale price in San Diego was $446 per square foot in Q2 2026, per Kidder Mathews, up 12.81% year-over-year from $395 in Q2 2025. However, pricing varies dramatically based on location, tenant quality, and lease terms.
Should I be concerned about office vacancy spilling over into Mission Valley retail?
Mission Valley’s office submarket has a 13.9% vacancy rate with 7,579,024 square feet of total inventory, per Kidder Mathews Q2 2026 data. Positively, the submarket recorded 103,267 square feet of positive year-to-date net absorption, showing more resilience than downtown. Office weakness can reduce foot traffic near mixed-use retail, so factor in your center’s proximity to office corridors.
The Bottom Line
Mission Valley in 2026 is a compelling but complex retail investment story. Vacancy is low, supply is constrained, and thousands of new residents are coming. But rent growth has decelerated, net absorption is negative, and construction disruption will define the submarket for years. Your underwriting needs to reflect all of these realities, not just the ones that make the deal look good.
If you’re evaluating a retail strip center acquisition in Mission Valley or anywhere else in San Diego, I’d welcome the conversation. As a Broker Associate with REAL Brokerage and 18 years of San Diego market experience, I bring clarity to complex investment decisions. You can reach me, Scott Cheng, at 858-405-0002, or visit my office at 16516 Bernardo Center Dr. Ste. 300. Let’s look at the numbers together and make sure your next investment move is built on a solid foundation.
Have Questions About San Diego Real Estate?
Scott Cheng provides free, no-obligation consultations for buyers, sellers, and investors.
Schedule a Consultation