Realistic Cap Rates for Mixed-Use Properties in Little Italy San Diego
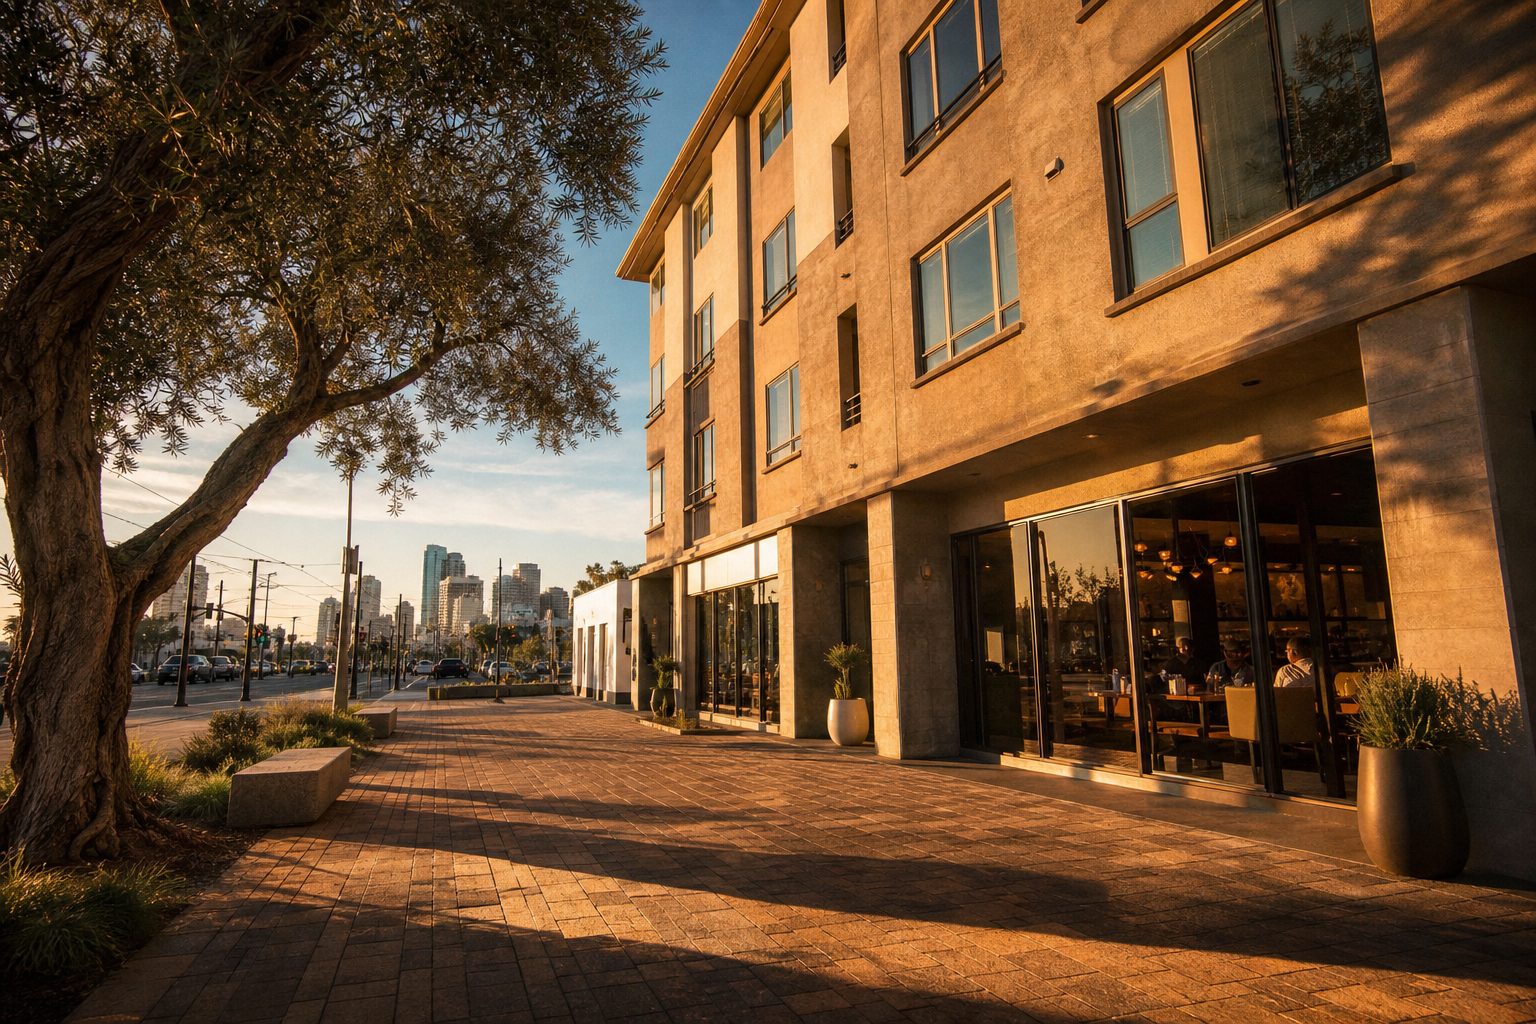
What cap rates are realistic for a mixed-use commercial property in Little Italy, San Diego, in 2026, and how do you know if the asking price is justified?
[SNIPPET ANSWER: Stabilized mixed-use properties in Little Italy realistically trade at 4.75% to 5.75% cap rates in 2026. You justify the asking price by independently reconstructing the NOI, benchmarking against comparable sales, and stress-testing the exit cap rate.]
Why Little Italy San Diego Cap Rates Matter Right Now
San Diego’s commercial real estate market in 2026 is not in distress. It is in repricing. And that distinction matters enormously if you are evaluating a mixed-use property in Little Italy.
I work with commercial investors across San Diego, and what I keep telling my clients is this: a cloudy mind can’t make decisions. The goal right now is clarity, not speed. With 5.4 months of condo inventory in the downtown 92101 ZIP code, units selling at 95.6% of original list price, and average days on market stretching to 66, there is real negotiating room for commercial buyers. The question is not whether deals exist. The question is whether you can accurately separate a fair price from an inflated one.
Little Italy’s Walk Score of 98, its dedicated trolley station, and one of the densest dining corridors in Southern California along India Street and Kettner Boulevard make it a perennial draw for both tenants and customers. But premium location does not automatically mean premium returns. Let me walk you through what the numbers actually look like.
What Cap Rates to Expect for Little Italy Mixed-Use in 2026
You need to think about a mixed-use building in Little Italy as two separate income streams blended into one cap rate. The residential floors compress toward multifamily benchmarks. The ground-floor retail or restaurant space trades at a wider spread.
Here is how the components break down across San Diego in 2026:
- Class A Multifamily: 4.5% to 4.8% cap rate
- Class B Multifamily: 4.9% to 5.2% cap rate (Class B assets have compressed down to roughly 4.92%)
- Class C Multifamily: 5.3% to 5.5% cap rate (averaging around 5.38%)
- Top-Tier NNN Retail: 5.0% to 6.0% cap rate
- Average Retail: 6.5% to 7.0% cap rate
When you blend the residential component (closer to 4.5% to 5.0%) with the retail component (closer to 5.5% to 6.5%), a stabilized mixed-use property in Little Italy should realistically trade in the 4.75% to 5.75% range. The exact landing point depends on tenant quality, lease terms, residential occupancy, building condition, and whether rents sit at, above, or below market.
So what does that actually mean for your offer? If a seller is quoting a cap rate below 4.5% on a mixed-use building, you should be asking hard questions about how they calculated their NOI. And if the marketed cap rate is above 6%, something about the income stream or the building itself probably needs scrutiny.
How to Verify If the Asking Price Is Justified in San Diego
Having closed over 275 transactions across San Diego over 16 years, I can tell you that the single most common mistake commercial investors make is trusting the seller’s NOI at face value. Here is the process I walk my clients through:
Reconstruct the NOI Yourself
Seller-provided NOI is a starting point, not the truth. You need to verify income against actual leases and bank deposit records. Reconstruct expenses from real utility bills, insurance invoices, property tax statements, and maintenance records. Sellers routinely understate management fees, defer maintenance, and omit capital reserves to inflate their NOI. Normalize every line item to reflect true ownership economics before you derive your own cap rate.
Benchmark Against Comparable Sales
One investor I worked with was evaluating a mixed-use building near Kettner Boulevard in Little Italy. The seller’s broker was marketing a 5.1% cap rate. When we reconstructed the NOI using actual lease documents and market-rate expense assumptions, the true cap rate was closer to 4.4%. That gap represented over $200,000 in overpayment risk. The investor walked away and found a more honestly priced asset two months later.
You always need to ask: compared to what? A cap rate means nothing in isolation. It only becomes useful when you benchmark it against properties of similar type, submarket, lease structure, and tenant quality.
Stress-Test Your Exit Cap Rate
Today’s going-in cap rate matters less than the cap rate environment at your planned exit. With roughly 6,400 new multifamily units forecast to deliver for the second consecutive year in San Diego (nearly doubling the market’s long-term annual average), you should model your exit at 25 to 50 basis points wider than your acquisition cap rate. If the deal only works with cap rate compression at exit, the deal does not work.
Little Italy San Diego Rental and Demand Fundamentals for Investors
Before you can trust any cap rate, you need to understand the demand profile underneath it. Little Italy’s fundamentals tell a clear story.
The average apartment rent in Little Italy is $3,479 per month, up 0.88% year over year. Studios average $3,112 for 559 square feet. One-bedrooms average $3,614 for 754 square feet. Two-bedrooms run $4,759 for 1,133 square feet. Those are strong rental figures, but the growth is modest, not explosive.
Here is the critical detail: 77% of Little Italy households are renter-occupied, while only 23% are owner-occupied. That renter-heavy profile supports consistent demand for the residential component of any mixed-use building. But it also means you are competing for tenants alongside a significant new supply pipeline. The City of San Diego issued more than 650 housing-relevant development permits in the Downtown community planning area over the past 12 months.
What I tell my clients is to model rent growth conservatively at 1% to 2% annually for the next three years and make sure the deal pencils at that pace. If you need 4% annual rent growth to hit your return targets, Little Italy in 2026 is probably not the right fit.
How Little Italy Compares to Other San Diego Neighborhoods for Commercial Investment
You might be wondering whether Little Italy offers the strongest risk-adjusted returns compared to other high-demand San Diego neighborhoods. The honest answer is that it depends on your investment thesis.
In North Park, the median home price sits around $961,000 with a median price per square foot of $786. Homes there are selling in roughly 21.5 days, with hot properties going pending in as few as 8 days. The average rental price is $3,092 per month. For a mixed-use investor, North Park‘s 30th Street and University Avenue corridor offers a more emerging commercial feel with potentially wider cap rates, but less institutional tenant demand than Little Italy’s India Street corridor.
Mission Hills, with its year-to-date median single-family price of $1,621,250 in ZIP 92103 and just 2.6 months of supply, is predominantly a residential play. Its commercial pockets along West Lewis Street are small. You are not finding the same density of ground-floor retail opportunity there.
Little Italy sits in a sweet spot: institutional-quality walkability, genuine retail demand driven by foot traffic and tourism, and a deep renter pool. The trade-off is tighter cap rates and more competition from new development.
Key Risks to Watch Before You Buy Mixed-Use in Little Italy
Rated 5 out of 5 stars across 180 client reviews, I have built my reputation on being straightforward about risk. Here is what I would flag for any investor looking at Little Italy right now:
- New supply pressure. More than half of San Diego’s 6,400 projected new units are delivering in the Balboa Park and Mission Valley areas, but downtown and Little Italy will feel the ripple effects on vacancy and concessions.
- Flat NOI growth outlook. With rental increases running flat, vacancy trending upward in the broader downtown market (8.5%), and expenses rising, net operating incomes are not likely to improve materially through the end of 2026.
- Office-to-residential conversion competition. Senate Bill 6 allows residential and mixed-use projects on commercially zoned properties, creating new supply pathways that could add density near Little Italy’s waterfront.
- IRR and cash-on-cash reality. Market-wide IRR targets are sitting at roughly 7.70% with cash-on-cash returns at 4.8%. If you are underwriting to higher return thresholds, you need significant value-add or below-market acquisition pricing.
Frequently Asked Questions About Little Italy San Diego Cap Rates
What is a good cap rate for mixed-use in Little Italy in 2026?
A stabilized mixed-use property in Little Italy should trade in the 4.75% to 5.75% range. Properties with strong ground-floor tenants on long-term leases and high residential occupancy will compress toward the lower end. Buildings with vacancy, short-term leases, or deferred maintenance will sit at the wider end.
Why are Little Italy cap rates lower than other San Diego neighborhoods?
Little Italy’s Walk Score of 98, trolley access, and dense restaurant and retail corridor along India Street and Kettner Boulevard create consistent foot traffic and tenant demand. That premium location compresses cap rates compared to less walkable or less transit-connected neighborhoods.
How do I reconstruct NOI for a Little Italy mixed-use property?
Pull actual lease agreements, verify income against bank deposit records, request 24 months of utility bills, confirm property tax assessments, and add realistic management fees and capital reserves. Never rely on the seller’s pro forma without independent verification.
What residential rents should I underwrite for Little Italy?
Current averages are $3,112 for studios, $3,614 for one-bedrooms, and $4,759 for two-bedrooms. Rent growth has been approximately 0.88% year over year. Conservative underwriting should model 1% to 2% annual growth.
Is downtown San Diego condo pricing affecting Little Italy commercial values?
Yes. The year-to-date median condo sale price in ZIP 92101 is $622,500, down 14.1% from last year. Softening residential values can influence the residential component of a mixed-use building’s valuation.
What exit cap rate should I model for a Little Italy investment?
Model your exit at 25 to 50 basis points wider than your going-in cap rate. With significant new supply delivering and modest rent growth, cap rate compression at exit is not a reliable assumption in 2026.
How does new construction in San Diego affect Little Italy cap rates?
Roughly 6,400 new multifamily units are delivering annually, nearly doubling the long-term average. This supply adds competitive pressure on occupancy and rent growth, which can push cap rates wider over your hold period.
What percentage of Little Italy residents are renters?
Approximately 77% of Little Italy households are renter-occupied. This high renter concentration supports demand for the residential component of mixed-use buildings but also means significant competition for tenants.
Should I worry about office-to-residential conversions near Little Italy?
It is worth monitoring. Senate Bill 6 allows residential and mixed-use development on commercially zoned properties through 2033. Conversions near Little Italy’s waterfront could add new supply that competes with existing mixed-use buildings.
How long are mixed-use properties sitting on the market in downtown San Diego?
Properties in ZIP 92101 are averaging 66 days on market and selling at 95.6% of original list price. That timeline gives you negotiating room, but it also suggests sellers are adjusting expectations.
The Bottom Line on Little Italy San Diego Mixed-Use Investment
You can find a well-located mixed-use property in Little Italy at a realistic 4.75% to 5.75% cap rate in 2026, but only if you do the work to verify the numbers yourself. Reconstruct the NOI independently, benchmark against comparable transactions, stress-test your exit assumptions, and model rent growth conservatively.
San Diego’s commercial market is in repricing, not distress. The investors who approach this moment with discipline and clean information will be the ones who define the next cycle. If you are evaluating a mixed-use opportunity in Little Italy or anywhere across San Diego, I am happy to bring 16 years of local market experience and 275 closed transactions to help you think through the deal. Reach out to me, Scott Cheng, at 858-405-0002 or through my office at 16516 Bernardo Center Dr. Ste. 300, and let’s look at your numbers together.
*Scott Cheng is an Associate Broker with REAL Brokerage, DRE# 01509668, serving San Diego County. This blog is for informational purposes only and does not constitute financial, legal, or investment advice. Consult qualified professionals before making investment decisions.*
Have Questions About San Diego Real Estate?
Scott Cheng provides free, no-obligation consultations for buyers, sellers, and investors.
Schedule a Consultation